Beautiful Minimalistic Maps

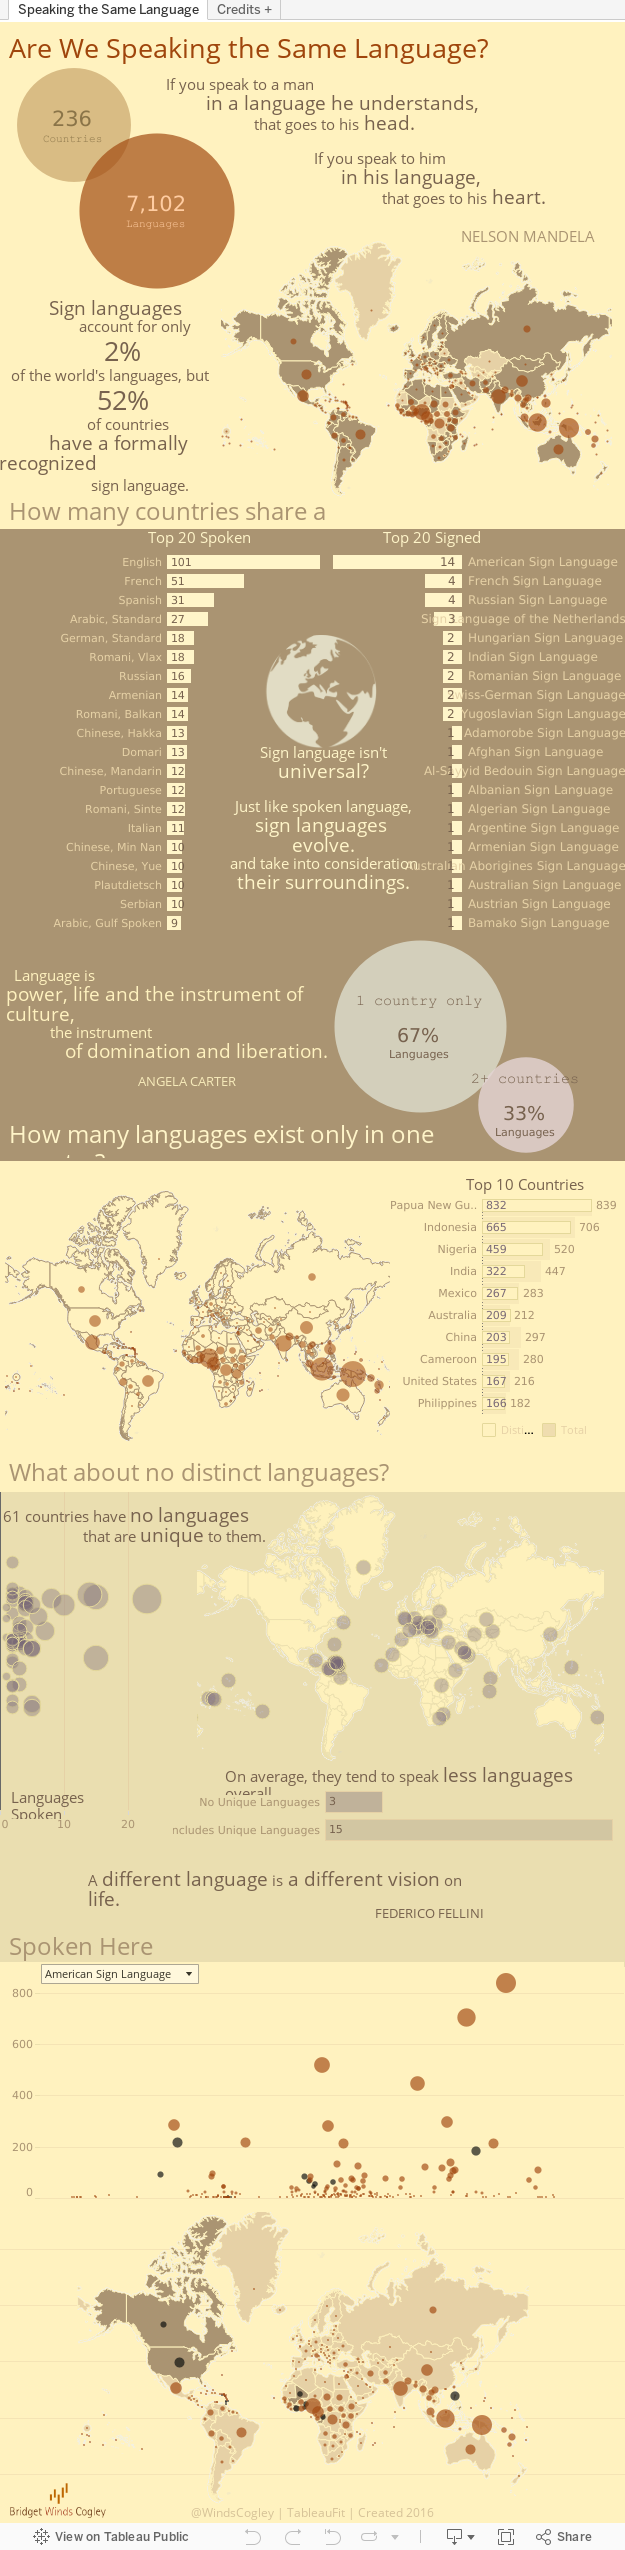
I just wanted the map to disappear. Not completely off the page, mind you. No, I wanted the information, but the map needed to support, not own, the information. Sort of like the difference between the background lounge singer and letting Lady Gaga do jazz. No matter how much she strips down her performance, the latter doesn’t disappear.

I could take it white, black, or various shades of grey. I could hit MapBox, but the labels. Holy labels. It’s like glitter after a party with 7-year-olds: the glitter just goes for days.

Labels, ma, labels
To make things complicated, I wanted this thing a shade of buttercream yellow. I wanted lines and variations on a theme. I could do a custom image, but frankly, I knew there was a simpler way.
And there was. Two ways, actually, as Jeff Shaffer also documented.
Smart people at this point would take the time to go visit Anya A’Hearn’s fantastic tutorials on MapBox. Unfortunately, some people are like toddlers. Be smart like Anya. Go watch and learn.

She walks you through this part.
So, for toddlers, too ADD to do it right, how to get a map yellow all over without 5 million labels? My solution – the Tableau Toddler way, not the right way – was to pull in my MapBox map and…get ready for this kids…completely disable all data layers.

“Hasta la vista, Map Layers!”
Now, I know you’re thinking, seriously?! You go make a MapBox map to disable it? Just wait…
Dual axis your shapes – filled map and dots. Dual axis is the trick that keeps on giving. Here’s the nice thing about MapBox: it holds the shape, unlike the regular Tableau map when you try to make it transparent. You see, MapBox STARTS transparent. You actually add color to it in the build process on their site. The regular map DOESN’T, so it washes away the background when you set it to transparent, so it becomes white. That’s the key here, kids. Transparency. In Tableau. So you can show your background.
So, go the MapBox route. Then, right click on the background and format. Know what happens next? The oceans…the blank space…everything.
The maps, look at how they fade for you
How they support the things you do
And they were all YELLOW!
…They were all YELLOW!
A little viz with the music:


Great viz and nice technique. I think you can do what you want in Tableau without using Mapbox though. Set the Map Style to Light, uncheck Base (this is what forces the water color), then right click on the map and select Format. Under Format Shading options, change the Default Pane shading to whatever color you like. With the base map off, the water will change to whatever color you like and you can change the other map options as you wish. If you find yourself doing this constantly, you can also add a style to your TMS file and then it’s your own style that is preset for you in the drop down list of styles. This was the technique we used in the War of TUGS viz for our Ohio map on the chalkboard I’ll write up a post on this, but let me know if you get your desired result.
Jeff: Thanks for the tips! I did try unchecking base with no success, but will definitely look through your post when it’s live in case I missed something (highly likely). Thanks again!